Question 02 · Wind power engineering
Can wind pay for an island?
Orkney has some of the strongest winds in Europe: 10.6 m/s average at hub height. I developed a tailored plan that puts five Vestas V150-6.0 turbines at Quanterness, using WindPRO and GIS mapping to cover siting, noise, shadow flicker, visibility, transport logistics, and a 20-year community-owned business case.
Scroll ↓
The actual analysis, on the actual map.
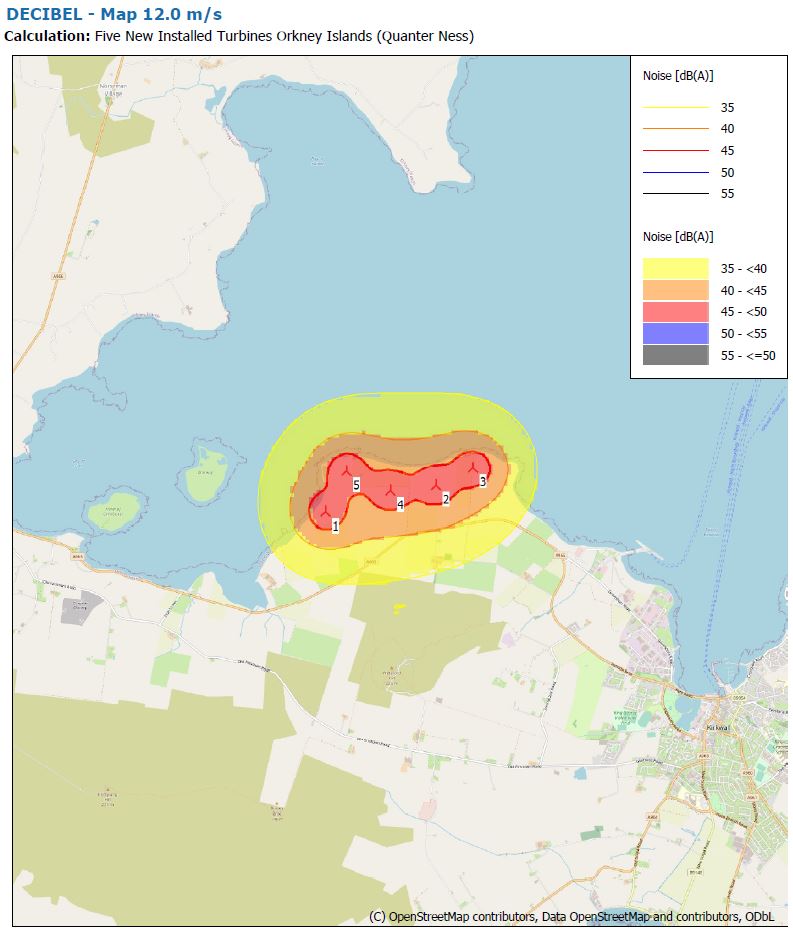
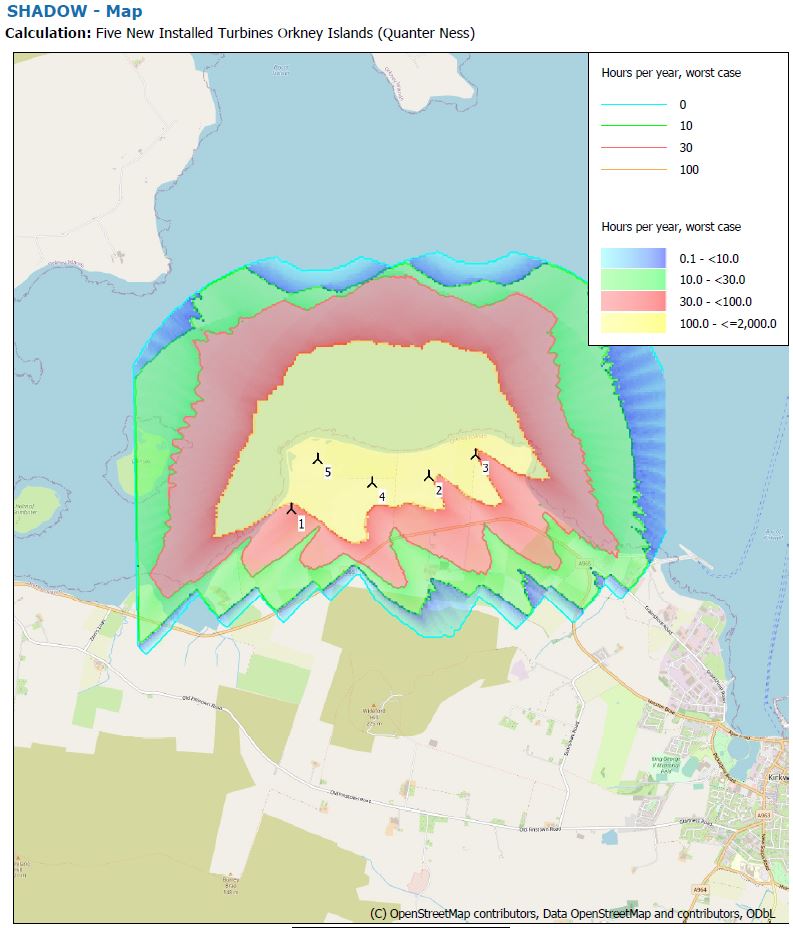
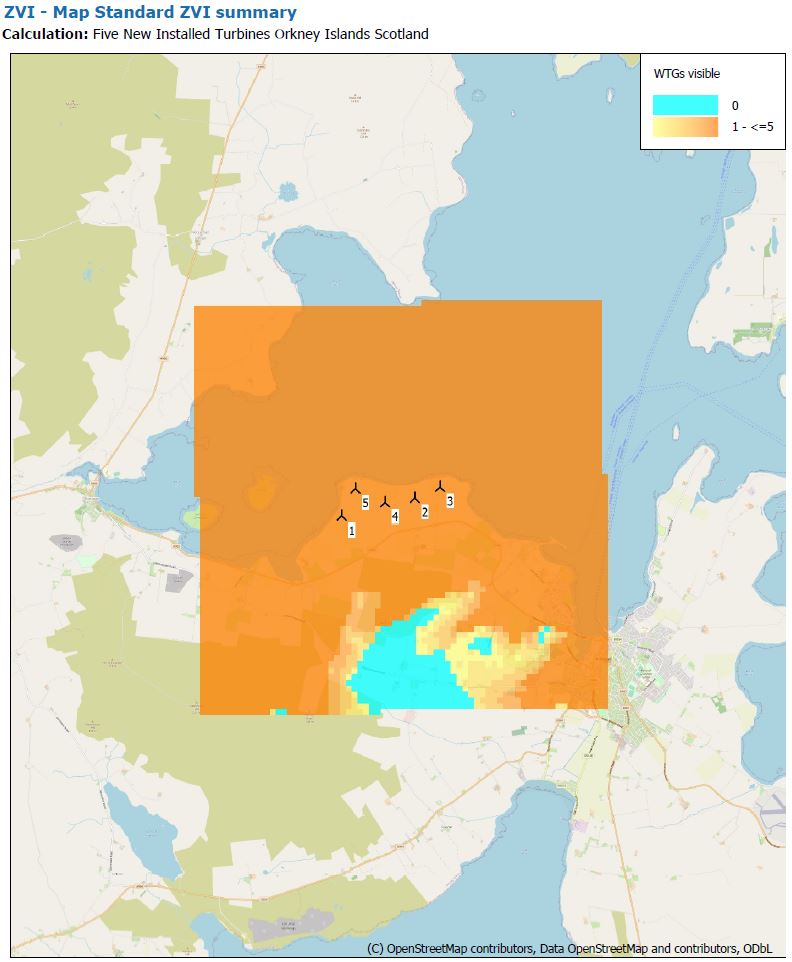
These are not illustrations. They are the georeferenced WindPRO output layers from the study, exported from the project files. Toggle them over the real Quanterness site: predicted noise at 12 m/s, worst-case shadow flicker hours per year, and the zone of visual influence across the island.
Wind you can bank on.
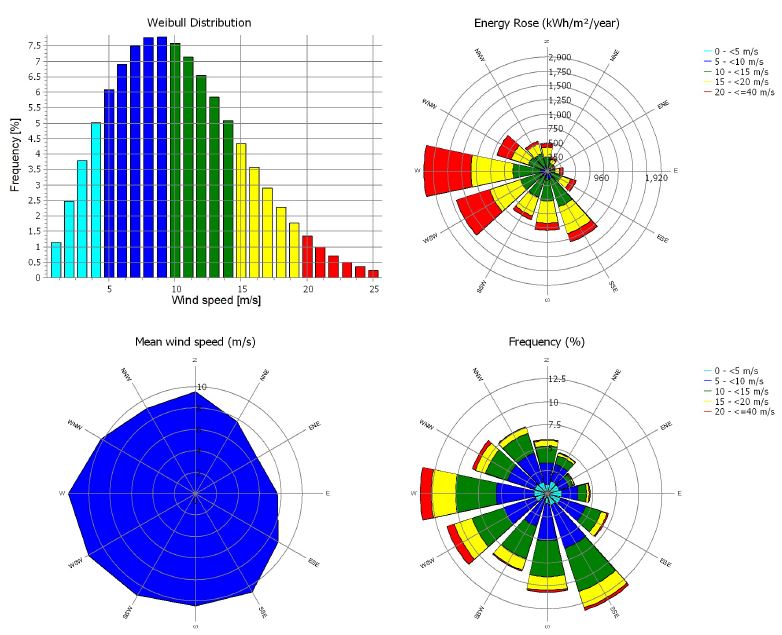
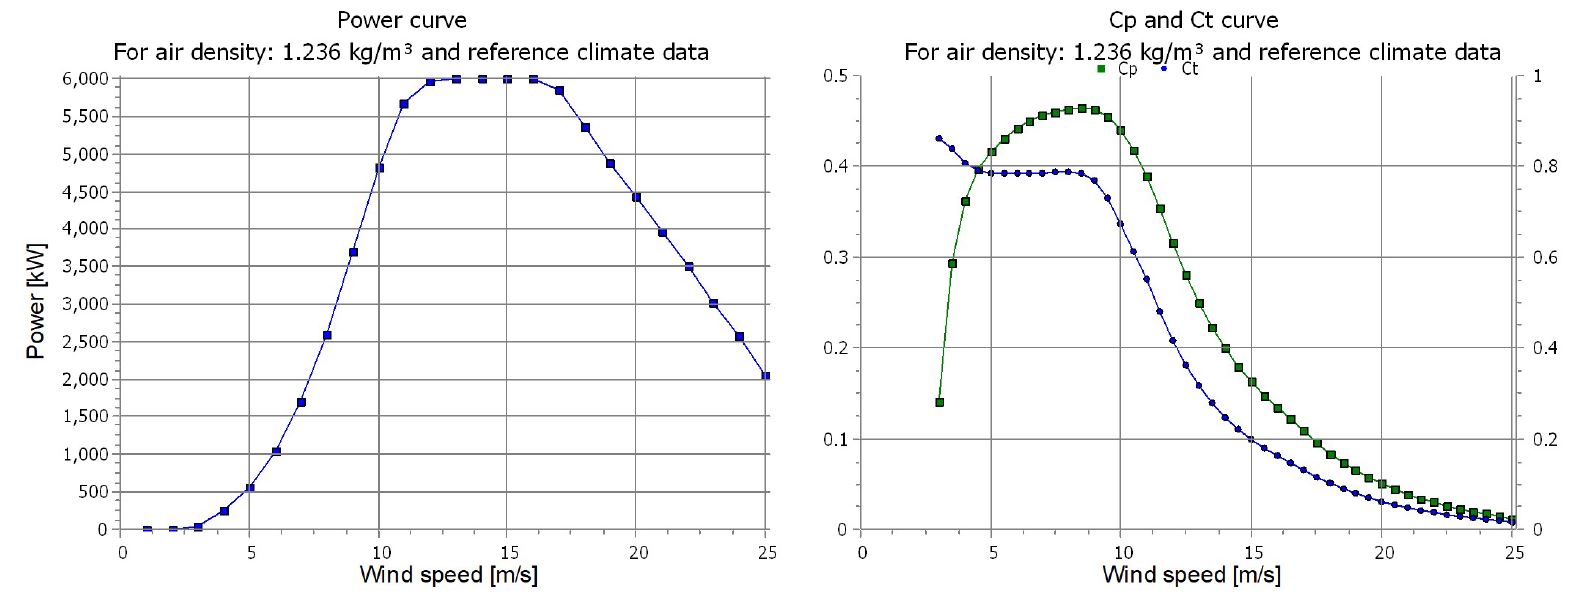
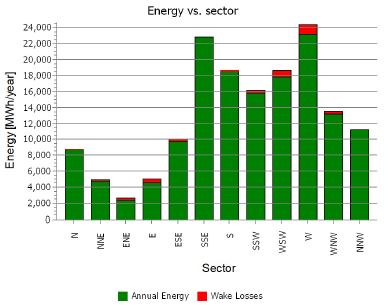
Siting begins with the resource: Weibull-fitted wind statistics, an energy rose dominated by westerlies, and steady speeds above the turbine’s 3 m/s cut-in. I selected the V150-6.0 by comparing power curves against the site’s wind distribution and weighing its 6 MW rating, 150 m rotor, and alternative hub-height options, not by catalogue preference.
A turbine is easy. Getting it there isn’t.
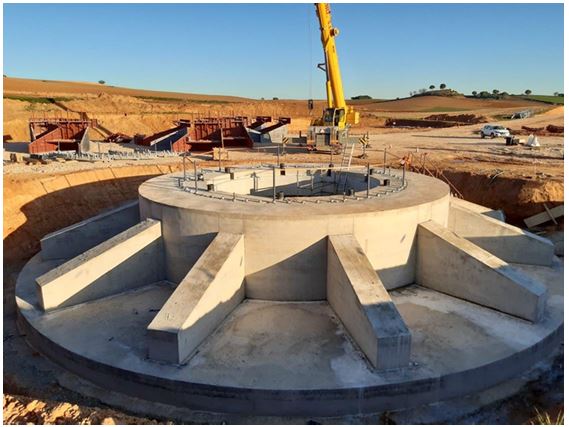
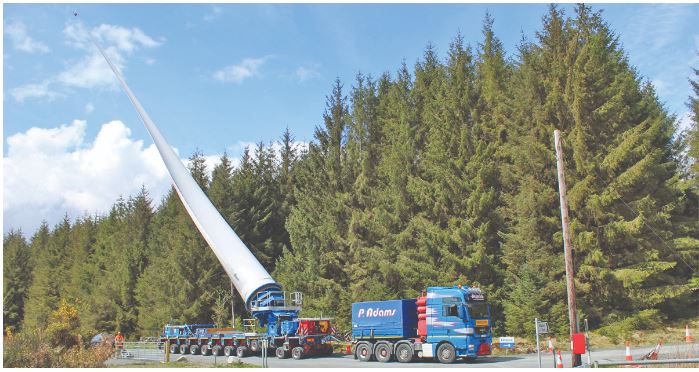
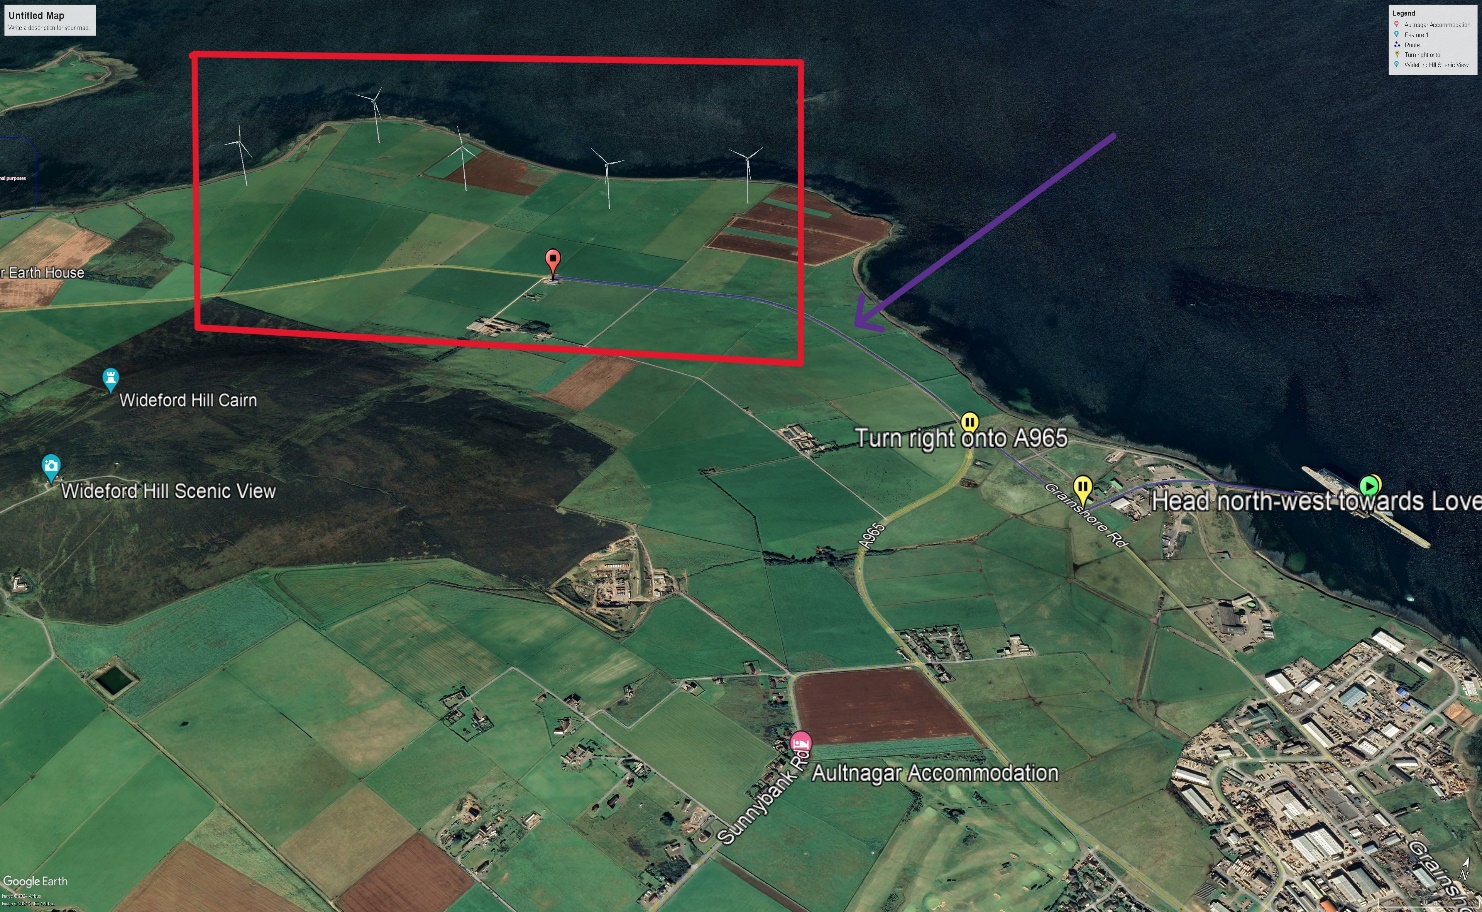
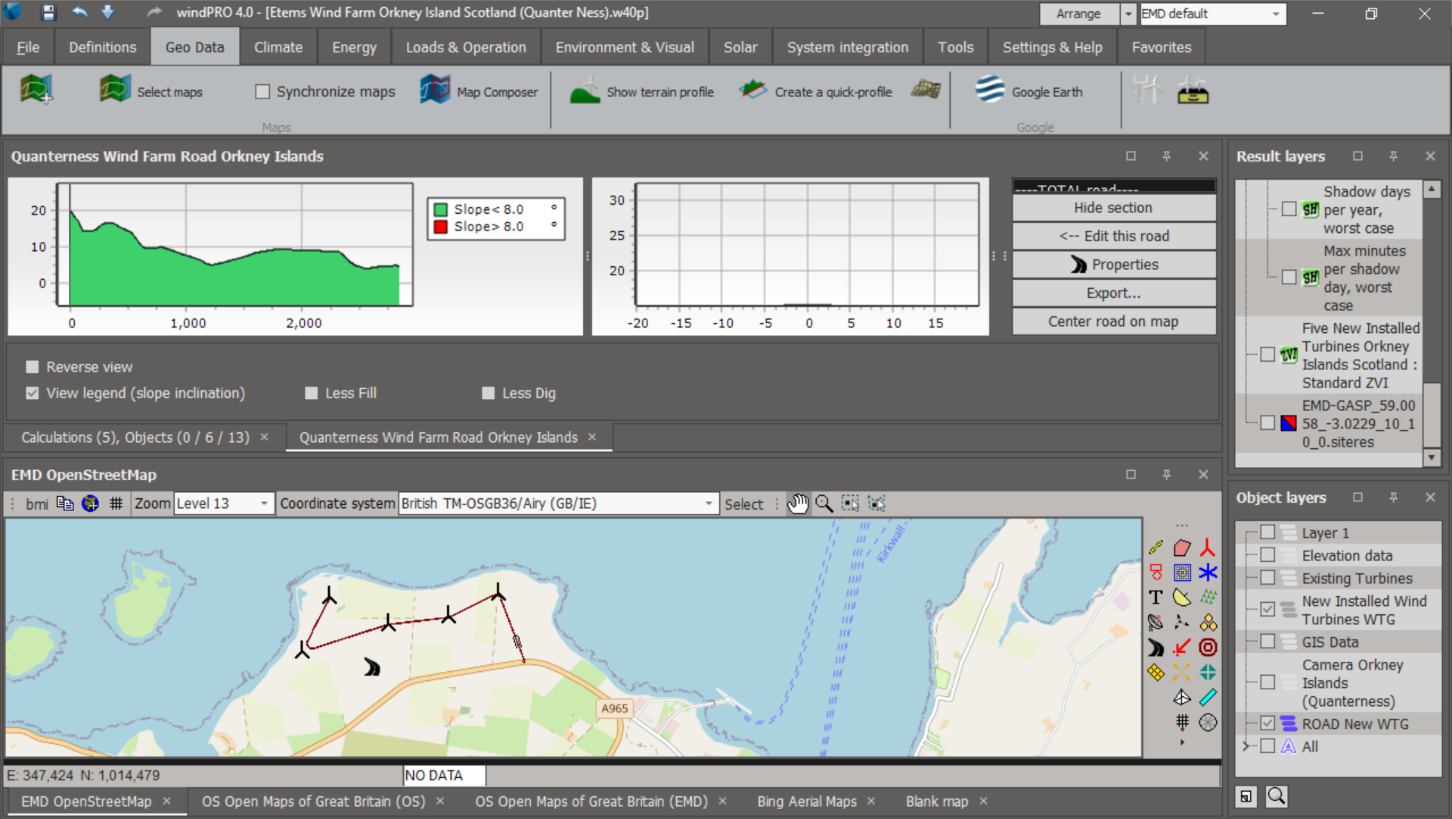
The plan covers what desk studies usually skip: 73.7-metre blades shipped from Denmark to Kirkwall, specialist haulage under police escort, a new approved junction off the A965, access-road costing per turbine position, cable trenching, and grid connection, plus a three-year preconstruction programme with the critical path mapped in MS Project. A development strategy, not a turbine layout alone.
And the number that decides everything.
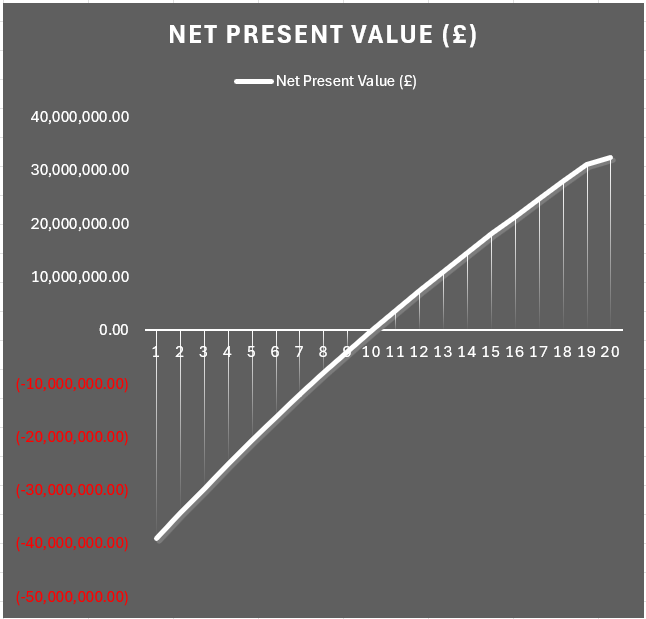
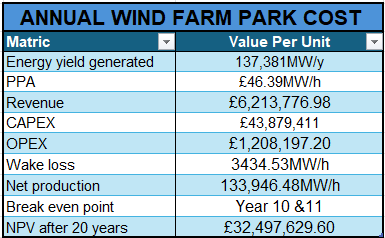
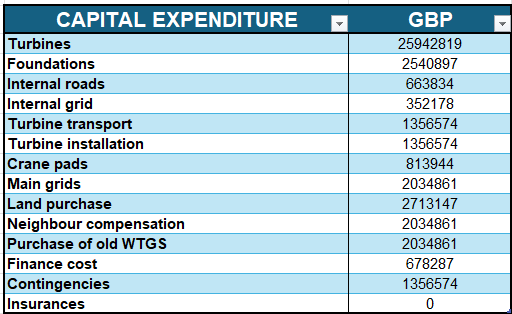
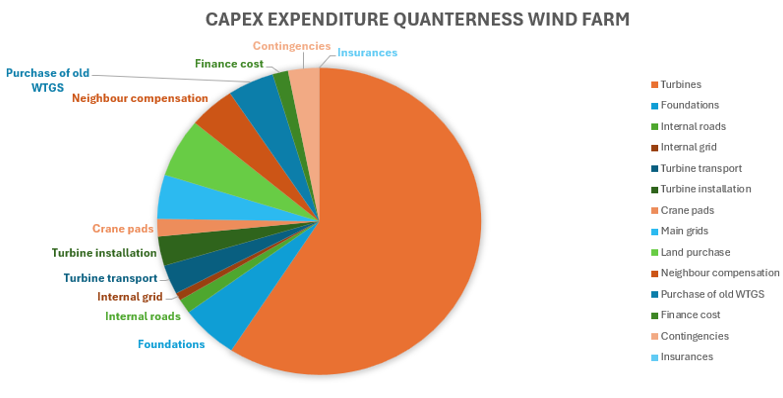
Twenty years of cash flows against £43.9M capital expenditure, under a Contract for Difference. The project breaks even at year 10–11 and finishes with a £32.5M net present value, with profits retained by the Orkney community that hosts it.
Original files
The report plus the actual Google Earth layers. Open the .kmz files in Google Earth.
Full report: Tailored Approach Plan for a Wind Farm.docx · 6 MB Site layout with 3D turbine models.kmz · 0.3 MB Noise decibel layer.kmz Shadow flicker layer.kmz Zones of visual influence layer.kmz Access road layout.kmz